 We know this is a problem for a lot of web developers at Microsoft, and wanted to improve the situation for everyone out there too. So, to help decipher minified function names we are introducing a new feature in the Performance tool that can create unminified versions of performance profiles. This feature is available starting in Microsoft Edge 99. It works by fetching the source maps associated to the code found in a profile and resolving the corresponding function names. If you already publish source maps with your source code, this feature is for you. Try capturing a profile then click the “Unminify profile” button in the toolbar, it will prompt you to save a new file to your machine. To understand the benefits of this feature, let’s review a before and after comparison of a performance profile. As you will see in the after version, highlighted in red, the function names now appear unminified, making it much easier to make sense of the recording. Before
 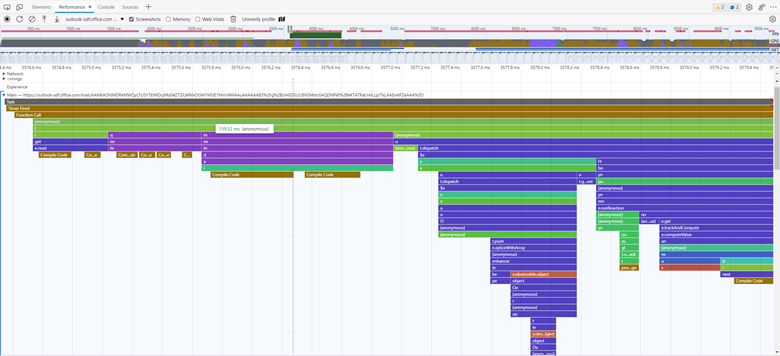 After
After 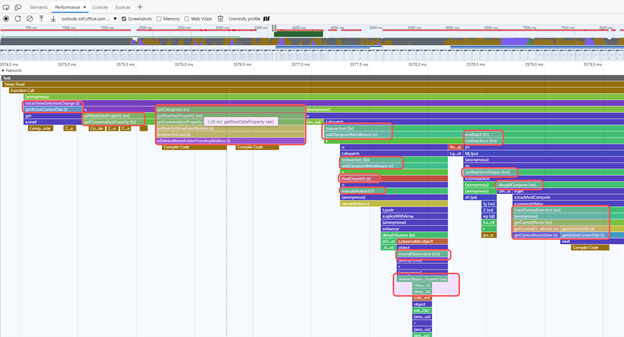 We would love for you to try this and let us know if it makes your life easier. You can share your feedback by using the feedback button in DevTools. This will help us to improve this tool in the future! This feature is early in the making and we are aware of some issues. The heuristic for resolving function names is not perfect yet and the tool may have trouble finding source maps that are not hosted next to JavaScript files or if their URLs are inline. We are already working on ways to improve this in upcoming releases. We hope this proves useful in your performance investigations. Happy debugging!
via https://www.aiupnow.com
Microsoft Edge Team, Khareem Sudlow
