The k-fold cross-validation procedure is a standard method for estimating the performance of a machine learning algorithm or configuration on a dataset.
A single run of the k-fold cross-validation procedure may result in a noisy estimate of model performance. Different splits of the data may result in very different results.
Repeated k-fold cross-validation provides a way to improve the estimated performance of a machine learning model. This involves simply repeating the cross-validation procedure multiple times and reporting the mean result across all folds from all runs. This mean result is expected to be a more accurate estimate of the true unknown underlying mean performance of the model on the dataset, as calculated using the standard error.
In this tutorial, you will discover repeated k-fold cross-validation for model evaluation.
After completing this tutorial, you will know:
- The mean performance reported from a single run of k-fold cross-validation may be noisy.
- Repeated k-fold cross-validation provides a way to reduce the error in the estimate of mean model performance.
- How to evaluate machine learning models using repeated k-fold cross-validation in Python.
Let’s get started.

Repeated k-Fold Cross-Validation for Model Evaluation in Python
Photo by lina smith, some rights reserved.
Tutorial Overview
This tutorial is divided into three parts; they are:
- k-Fold Cross-Validation
- Repeated k-Fold Cross-Validation
- Repeated k-Fold Cross-Validation in Python
k-Fold Cross-Validation
It is common to evaluate machine learning models on a dataset using k-fold cross-validation.
The k-fold cross-validation procedure divides a limited dataset into k non-overlapping folds. Each of the k folds is given an opportunity to be used as a held back test set, whilst all other folds collectively are used as a training dataset. A total of k models are fit and evaluated on the k hold-out test sets and the mean performance is reported.
For more on the k-fold cross-validation procedure, see the tutorial:
The k-fold cross-validation procedure can be implemented easily using the scikit-learn machine learning library.
First, let’s define a synthetic classification dataset that we can use as the basis of this tutorial.
The make_classification() function can be used to create a synthetic binary classification dataset. We will configure it to generate 1,000 samples each with 20 input features, 15 of which contribute to the target variable.
The example below creates and summarizes the dataset.
# test classification dataset
from sklearn.datasets import make_classification
# define dataset
X, y = make_classification(n_samples=1000, n_features=20, n_informative=15, n_redundant=5, random_state=1)
# summarize the dataset
print(X.shape, y.shape)
Running the example creates the dataset and confirms that it contains 1,000 samples and 10 input variables.
The fixed seed for the pseudorandom number generator ensures that we get the same samples each time the dataset is generated.
(1000, 20) (1000,)
Next, we can evaluate a model on this dataset using k-fold cross-validation.
We will evaluate a LogisticRegression model and use the KFold class to perform the cross-validation, configured to shuffle the dataset and set k=10, a popular default.
The cross_val_score() function will be used to perform the evaluation, taking the dataset and cross-validation configuration and returning a list of scores calculated for each fold.
The complete example is listed below.
# evaluate a logistic regression model using k-fold cross-validation
from numpy import mean
from numpy import std
from sklearn.datasets import make_classification
from sklearn.model_selection import KFold
from sklearn.model_selection import cross_val_score
from sklearn.linear_model import LogisticRegression
# create dataset
X, y = make_classification(n_samples=1000, n_features=20, n_informative=15, n_redundant=5, random_state=1)
# prepare the cross-validation procedure
cv = KFold(n_splits=10, random_state=1, shuffle=True)
# create model
model = LogisticRegression()
# evaluate model
scores = cross_val_score(model, X, y, scoring='accuracy', cv=cv, n_jobs=-1)
# report performance
print('Accuracy: %.3f (%.3f)' % (mean(scores), std(scores)))
Running the example creates the dataset, then evaluates a logistic regression model on it using 10-fold cross-validation. The mean classification accuracy on the dataset is then reported.
Your specific results may vary given the stochastic nature of the learning algorithm. Try running the example a few times.
In this case, we can see that the model achieved an estimated classification accuracy of about 86.8 percent.
Accuracy: 0.868 (0.032)
Now that we are familiar with k-fold cross-validation, let’s look at an extension that repeats the procedure.
Repeated k-Fold Cross-Validation
The estimate of model performance via k-fold cross-validation can be noisy.
This means that each time the procedure is run, a different split of the dataset into k-folds can be implemented, and in turn, the distribution of performance scores can be different, resulting in a different mean estimate of model performance.
The amount of difference in the estimated performance from one run of k-fold cross-validation to another is dependent upon the model that is being used and on the dataset itself.
A noisy estimate of model performance can be frustrating as it may not be clear which result should be used to compare and select a final model to address the problem.
One solution to reduce the noise in the estimated model performance is to increase the k-value. This will reduce the bias in the model’s estimated performance, although it will increase the variance: e.g. tie the result more to the specific dataset used in the evaluation.
An alternate approach is to repeat the k-fold cross-validation process multiple times and report the mean performance across all folds and all repeats. This approach is generally referred to as repeated k-fold cross-validation.
… repeated k-fold cross-validation replicates the procedure […] multiple times. For example, if 10-fold cross-validation was repeated five times, 50 different held-out sets would be used to estimate model efficacy.
— Page 70, Applied Predictive Modeling, 2013.
Importantly, each repeat of the k-fold cross-validation process must be performed on the same dataset split into different folds.
Repeated k-fold cross-validation has the benefit of improving the estimate of the mean model performance at the cost of fitting and evaluating many more models.
Common numbers of repeats include 3, 5, and 10. For example, if 3 repeats of 10-fold cross-validation are used to estimate the model performance, this means that (3 * 10) or 30 different models would need to be fit and evaluated.
- Appropriate: for small datasets and simple models (e.g. linear).
As such, the approach is suited for small- to modestly-sized datasets and/or models that are not too computationally costly to fit and evaluate. This suggests that the approach may be appropriate for linear models and not appropriate for slow-to-fit models like deep learning neural networks.
Like k-fold cross-validation itself, repeated k-fold cross-validation is easy to parallelize, where each fold or each repeated cross-validation process can be executed on different cores or different machines.
Repeated k-Fold Cross-Validation in Python
The scikit-learn Python machine learning library provides an implementation of repeated k-fold cross-validation via the RepeatedKFold class.
The main parameters are the number of folds (n_splits), which is the “k” in k-fold cross-validation, and the number of repeats (n_repeats).
A good default for k is k=10.
A good default for the number of repeats depends on how noisy the estimate of model performance is on the dataset. A value of 3, 5, or 10 repeats is probably a good start. More repeats than 10 are probably not required.
...
# prepare the cross-validation procedure
cv = RepeatedKFold(n_splits=10, n_repeats=3, random_state=1)
The example below demonstrates repeated k-fold cross-validation of our test dataset.
# evaluate a logistic regression model using repeated k-fold cross-validation
from numpy import mean
from numpy import std
from sklearn.datasets import make_classification
from sklearn.model_selection import RepeatedKFold
from sklearn.model_selection import cross_val_score
from sklearn.linear_model import LogisticRegression
# create dataset
X, y = make_classification(n_samples=1000, n_features=20, n_informative=15, n_redundant=5, random_state=1)
# prepare the cross-validation procedure
cv = RepeatedKFold(n_splits=10, n_repeats=3, random_state=1)
# create model
model = LogisticRegression()
# evaluate model
scores = cross_val_score(model, X, y, scoring='accuracy', cv=cv, n_jobs=-1)
# report performance
print('Accuracy: %.3f (%.3f)' % (mean(scores), std(scores)))
Running the example creates the dataset, then evaluates a logistic regression model on it using 10-fold cross-validation with three repeats. The mean classification accuracy on the dataset is then reported.
Your specific results may vary given the stochastic nature of the learning algorithm. Try running the example a few times.
In this case, we can see that the model achieved an estimated classification accuracy of about 86.7 percent, which is lower than the single run result reported previously of 86.8 percent. This may suggest that the single run result may be optimistic and that the result from three repeats might be a better estimate of the true mean model performance.
Accuracy: 0.867 (0.031)
The expectation of repeated k-fold cross-validation is that the repeated mean would be a more reliable estimate of model performance than the result of a single k-fold cross-validation procedure.
This may mean less statistical noise.
One way this could be measured is by comparing the distributions of mean performance scores under differing numbers of repeats.
We can imagine that there is a true unknown underlying mean performance of a model on a dataset and that repeated k-fold cross-validation runs estimate this mean. We can estimate the error in the mean performance from the true unknown underlying mean performance using a statistical tool called the standard error.
The standard error can provide an indication for a given sample size of the amount of error or the spread of error that may be expected from the sample mean to the underlying and unknown population mean.
Standard error can be calculated as follows:
- standard_error = sample_standard_deviation / sqrt(number of repeats)
We can calculate the standard error for a sample using the sem() scipy function.
Ideally, we would like to select a number of repeats that shows both minimization of the standard error and stabilizing of the mean estimated performance compared to other numbers of repeats.
The example below demonstrates this by reporting model performance with 10-fold cross-validation with 1 to 15 repeats of the procedure.
We would expect that more repeats of the procedure would result in a more accurate estimate of the mean model performance, given the law of large numbers. Although, the trials are not independent, so the underlying statistical principles become challenging.
# compare the number of repeats for repeated k-fold cross-validation
from scipy.stats import sem
from numpy import mean
from numpy import std
from sklearn.datasets import make_classification
from sklearn.model_selection import RepeatedKFold
from sklearn.model_selection import cross_val_score
from sklearn.linear_model import LogisticRegression
from matplotlib import pyplot

# evaluate a model with a given number of repeats
def evaluate_model(X, y, repeats):
        # prepare the cross-validation procedure
        cv = RepeatedKFold(n_splits=10, n_repeats=repeats, random_state=1)
        # create model
        model = LogisticRegression()
        # evaluate model
        scores = cross_val_score(model, X, y, scoring='accuracy', cv=cv, n_jobs=-1)
        return scores

# create dataset
X, y = make_classification(n_samples=1000, n_features=20, n_informative=15, n_redundant=5, random_state=1)
# configurations to test
repeats = range(1,16)
results = list()
for r in repeats:
        # evaluate using a given number of repeats
        scores = evaluate_model(X, y, r)
        # summarize
        print('>%d mean=%.4f se=%.3f' % (r, mean(scores), sem(scores)))
        # store
        results.append(scores)
# plot the results
pyplot.boxplot(results, labels=[str(r) for r in repeats], showmeans=True)
pyplot.show()
Running the example reports the mean and standard error classification accuracy using 10-fold cross-validation with different numbers of repeats.
Your specific results may vary given the stochastic nature of the learning algorithm. Try running the example a few times.
In this case, we can see that the default of one repeat appears optimistic compared to the other results with an accuracy of about 86.80 percent compared to 86.73 percent and lower with differing numbers of repeats.
We can see that the mean seems to coalesce around a value of about 86.5 percent. We might take this as the stable estimate of model performance and in turn, choose 5 or 6 repeats that seem to approximate this value first.
Looking at the standard error, we can see that it decreases with an increase in the number of repeats and stabilizes with a value around 0.003 at around 9 or 10 repeats, although 5 repeats achieve a standard error of 0.005, half of that achieved with a single repeat.
>1 mean=0.8680 se=0.011
>2 mean=0.8675 se=0.008
>3 mean=0.8673 se=0.006
>4 mean=0.8670 se=0.006
>5 mean=0.8658 se=0.005
>6 mean=0.8655 se=0.004
>7 mean=0.8651 se=0.004
>8 mean=0.8651 se=0.004
>9 mean=0.8656 se=0.003
>10 mean=0.8658 se=0.003
>11 mean=0.8655 se=0.003
>12 mean=0.8654 se=0.003
>13 mean=0.8652 se=0.003
>14 mean=0.8651 se=0.003
>15 mean=0.8653 se=0.003
A box and whisker plot is created to summarize the distribution of scores for each number of repeats.
The orange line indicates the median of the distribution and the green triangle represents the arithmetic mean. If these symbols (values) coincide, it suggests a reasonable symmetric distribution and that the mean may capture the central tendency well.
This might provide an additional heuristic for choosing an appropriate number of repeats for your test harness.
Taking this into consideration, using five repeats with this chosen test harness and algorithm appears to be a good choice.
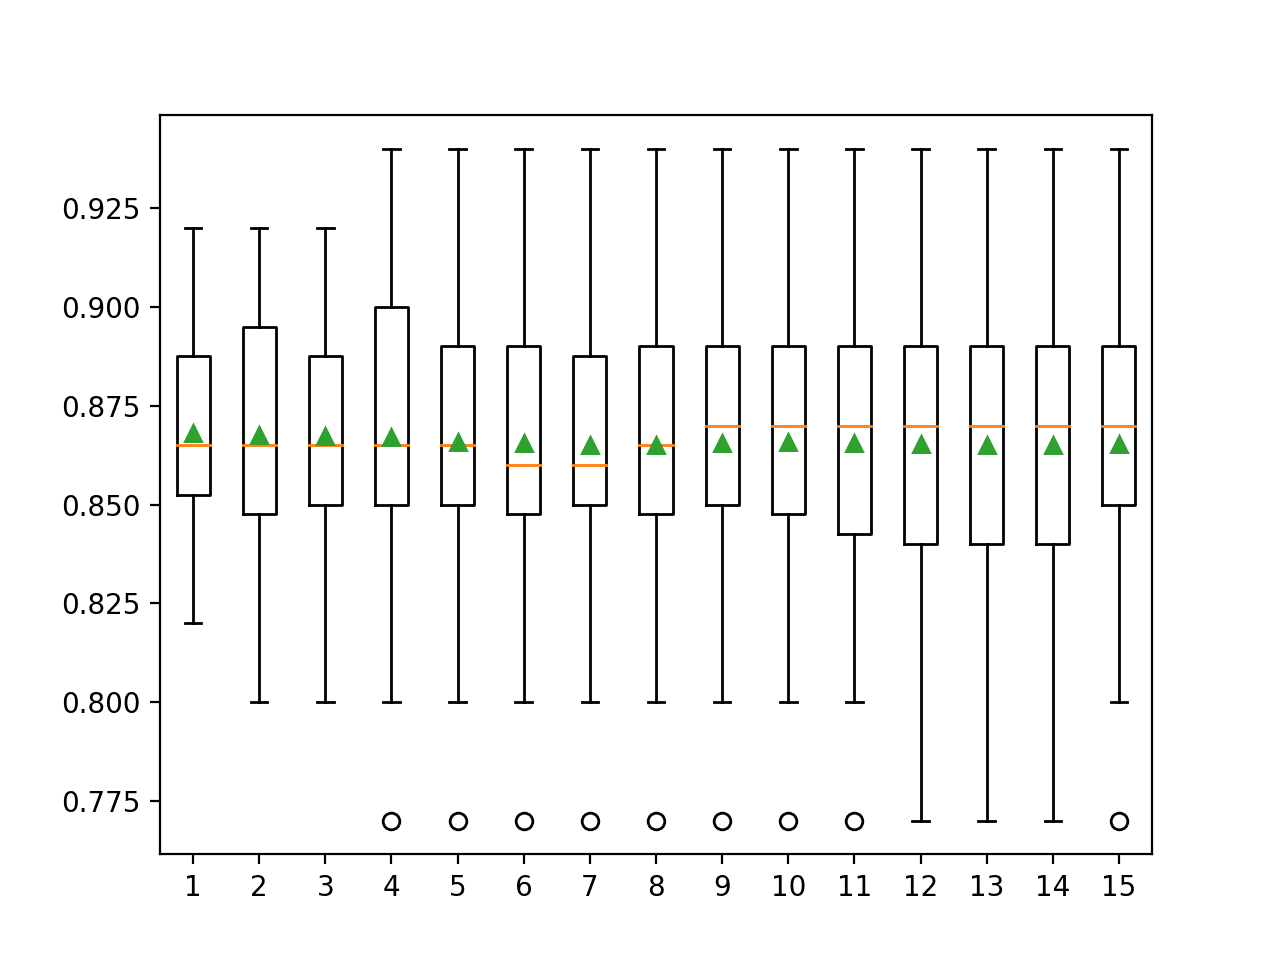
Box and Whisker Plots of Classification Accuracy vs Repeats for k-Fold Cross-Validation
Further Reading
This section provides more resources on the topic if you are looking to go deeper.
Tutorials
- A Gentle Introduction to k-fold Cross-Validation
- How to Fix k-Fold Cross-Validation for Imbalanced Classification
APIs
- sklearn.model_selection.KFold API.
- sklearn.model_selection.RepeatedKFold API.
- sklearn.model_selection.LeaveOneOut API.
- sklearn.model_selection.cross_val_score API.
Articles
Summary
In this tutorial, you discovered repeated k-fold cross-validation for model evaluation.
Specifically, you learned:
- The mean performance reported from a single run of k-fold cross-validation may be noisy.
- Repeated k-fold cross-validation provides a way to reduce the error in the estimate of mean model performance.
- How to evaluate machine learning models using repeated k-fold cross-validation in Python.
Do you have any questions?
Ask your questions in the comments below and I will do my best to answer.
The post Repeated k-Fold Cross-Validation for Model Evaluation in Python appeared first on Machine Learning Mastery.
Ai
via https://www.AiUpNow.com
August 2, 2020 at 03:09PM by Jason Brownlee, Khareem Sudlow
