Feature importance refers to techniques that assign a score to input features based on how useful they are at predicting a target variable.
There are many types and sources of feature importance scores, although popular examples include statistical correlation scores, coefficients calculated as part of linear models, decision trees, and permutation importance scores.
Feature importance scores play an important role in a predictive modeling project, including providing insight into the data, insight into the model, and the basis for dimensionality reduction and feature selection that can improve the efficiency and effectiveness of a predictive model on the problem.
In this tutorial, you will discover feature importance scores for machine learning in python
After completing this tutorial, you will know:
- The role of feature importance in a predictive modeling problem.
- How to calculate and review feature importance from linear models and decision trees.
- How to calculate and review permutation feature importance scores.
Let’s get started.

How to Calculate Feature Importance With Python
Photo by Bonnie Moreland, some rights reserved.
Tutorial Overview
This tutorial is divided into five parts; they are:
- Feature Importance
- Preparation
- Check Scikit-Learn Version
- Test Datasets
- Coefficients as Feature Importance
- Linear Regression Feature Importance
- Logistic Regression Feature Importance
- Decision Tree Feature Importance
- CART Feature Importance
- Random Forest Feature Importance
- XGBoost Feature Importance
- Permutation Feature Importance
- Permutation Feature Importance for Regression
- Permutation Feature Importance for Classification
Feature Importance
Feature importance refers to a class of techniques for assigning scores to input features to a predictive model that indicates the relative importance of each feature when making a prediction.
Feature importance scores can be calculated for problems that involve predicting a numerical value, called regression, and those problems that involve predicting a class label, called classification.
The scores are useful and can be used in a range of situations in a predictive modeling problem, such as:
- Better understanding the data.
- Better understanding a model.
- Reducing the number of input features.
Feature importance scores can provide insight into the dataset. The relative scores can highlight which features may be most relevant to the target, and the converse, which features are the least relevant. This may be interpreted by a domain expert and could be used as the basis for gathering more or different data.
Feature importance scores can provide insight into the model. Most importance scores are calculated by a predictive model that has been fit on the dataset. Inspecting the importance score provides insight into that specific model and which features are the most important and least important to the model when making a prediction. This is a type of model interpretation that can be performed for those models that support it.
Feature importance can be used to improve a predictive model. This can be achieved by using the importance scores to select those features to delete (lowest scores) or those features to keep (highest scores). This is a type of feature selection and can simplify the problem that is being modeled, speed up the modeling process (deleting features is called dimensionality reduction), and in some cases, improve the performance of the model.
Feature importance scores can be fed to a wrapper model, such as SelectFromModel or SelectKBest, to perform feature selection.
There are many ways to calculate feature importance scores and many models that can be used for this purpose.
Perhaps the simplest way is to calculate simple coefficient statistics between each feature and the target variable. For more on this approach, see the tutorial:
In this tutorial, we will look at three main types of more advanced feature importance; they are:
- Feature importance from model coefficients.
- Feature importance from decision trees.
- Feature importance from permutation testing.
Let’s take a closer look at each.
Preparation
Before we dive in, let’s confirm our environment and prepare some test datasets.
Check Scikit-Learn Version
First, confirm that you have a modern version of the scikit-learn library installed.
This is important because some of the models we will explore in this tutorial require a modern version of the library.
You can check the version of the library you have installed with the following code example:
# check scikit-learn version
import sklearn
print(sklearn.__version__)
Running the example will print the version of the library. At the time of writing, this is about version 0.22.
You need to be using this version of scikit-learn or higher.
0.22.1
Test Datasets
Next, let’s define some test datasets that we can use as the basis for demonstrating and exploring feature importance scores.
Each test problem has five important and five unimportant features, and it may be interesting to see which methods are consistent at finding or differentiating the features based on their importance.
Classification Dataset
We will use the make_classification() function to create a test binary classification dataset.
The dataset will have 1,000 examples, with 10 input features, five of which will be informative and the remaining five will be redundant. We will fix the random number seed to ensure we get the same examples each time the code is run.
An example of creating and summarizing the dataset is listed below.
# test classification dataset
from sklearn.datasets import make_classification
# define dataset
X, y = make_classification(n_samples=1000, n_features=10, n_informative=5, n_redundant=5, random_state=1)
# summarize the dataset
print(X.shape, y.shape)
Running the example creates the dataset and confirms the expected number of samples and features.
(1000, 10) (1000,)
Regression Dataset
We will use the make_regression() function to create a test regression dataset.
Like the classification dataset, the regression dataset will have 1,000 examples, with 10 input features, five of which will be informative and the remaining five that will be redundant.
# test regression dataset
from sklearn.datasets import make_regression
# define dataset
X, y = make_regression(n_samples=1000, n_features=10, n_informative=5, random_state=1)
# summarize the dataset
print(X.shape, y.shape)
Running the example creates the dataset and confirms the expected number of samples and features.
(1000, 10) (1000,)
Next, let’s take a closer look at coefficients as importance scores.
Coefficients as Feature Importance
Linear machine learning algorithms fit a model where the prediction is the weighted sum of the input values.
Examples include linear regression, logistic regression, and extensions that add regularization, such as ridge regression and the elastic net.
All of these algorithms find a set of coefficients to use in the weighted sum in order to make a prediction. These coefficients can be used directly as a crude type of feature importance score.
Let’s take a closer look at using coefficients as feature importance for classification and regression. We will fit a model on the dataset to find the coefficients, then summarize the importance scores for each input feature and finally create a bar chart to get an idea of the relative importance of the features.
Linear Regression Feature Importance
We can fit a LinearRegression model on the regression dataset and retrieve the coeff_ property that contains the coefficients found for each input variable.
These coefficients can provide the basis for a crude feature importance score. This assumes that the input variables have the same scale or have been scaled prior to fitting a model.
The complete example of linear regression coefficients for feature importance is listed below.
# linear regression feature importance
from sklearn.datasets import make_regression
from sklearn.linear_model import LinearRegression
from matplotlib import pyplot
# define dataset
X, y = make_regression(n_samples=1000, n_features=10, n_informative=5, random_state=1)
# define the model
model = LinearRegression()
# fit the model
model.fit(X, y)
# get importance
importance = model.coef_
# summarize feature importance
for i,v in enumerate(importance):
        print('Feature: %0d, Score: %.5f' % (i,v))
# plot feature importance
pyplot.bar([x for x in range(len(importance))], importance)
pyplot.show()
Running the example fits the model, then reports the coefficient value for each feature.
The scores suggest that the model found the five important features and marked all other features with a zero coefficient, essentially removing them from the model.
Feature: 0, Score: 0.00000
Feature: 1, Score: 12.44483
Feature: 2, Score: -0.00000
Feature: 3, Score: -0.00000
Feature: 4, Score: 93.32225
Feature: 5, Score: 86.50811
Feature: 6, Score: 26.74607
Feature: 7, Score: 3.28535
Feature: 8, Score: -0.00000
Feature: 9, Score: 0.00000
A bar chart is then created for the feature importance scores.

Bar Chart of Linear Regression Coefficients as Feature Importance Scores
This approach may also be used with Ridge and ElasticNet models.
Logistic Regression Feature Importance
We can fit a LogisticRegression model on the regression dataset and retrieve the coeff_ property that contains the coefficients found for each input variable.
These coefficients can provide the basis for a crude feature importance score. This assumes that the input variables have the same scale or have been scaled prior to fitting a model.
The complete example of logistic regression coefficients for feature importance is listed below.
# logistic regression for feature importance
from sklearn.datasets import make_classification
from sklearn.linear_model import LogisticRegression
from matplotlib import pyplot
# define dataset
X, y = make_classification(n_samples=1000, n_features=10, n_informative=5, n_redundant=5, random_state=1)
# define the model
model = LogisticRegression()
# fit the model
model.fit(X, y)
# get importance
importance = model.coef_[0]
# summarize feature importance
for i,v in enumerate(importance):
        print('Feature: %0d, Score: %.5f' % (i,v))
# plot feature importance
pyplot.bar([x for x in range(len(importance))], importance)
pyplot.show()
Running the example fits the model, then reports the coefficient value for each feature.
Recall this is a classification problem with classes 0 and 1. Notice that the coefficients are both positive and negative. The positive scores indicate a feature that predicts class 1, whereas the negative scores indicate a feature that predicts class 0.
No clear pattern of important and unimportant features can be identified from these results, at least from what I can tell.
Feature: 0, Score: 0.16320
Feature: 1, Score: -0.64301
Feature: 2, Score: 0.48497
Feature: 3, Score: -0.46190
Feature: 4, Score: 0.18432
Feature: 5, Score: -0.11978
Feature: 6, Score: -0.40602
Feature: 7, Score: 0.03772
Feature: 8, Score: -0.51785
Feature: 9, Score: 0.26540
A bar chart is then created for the feature importance scores.
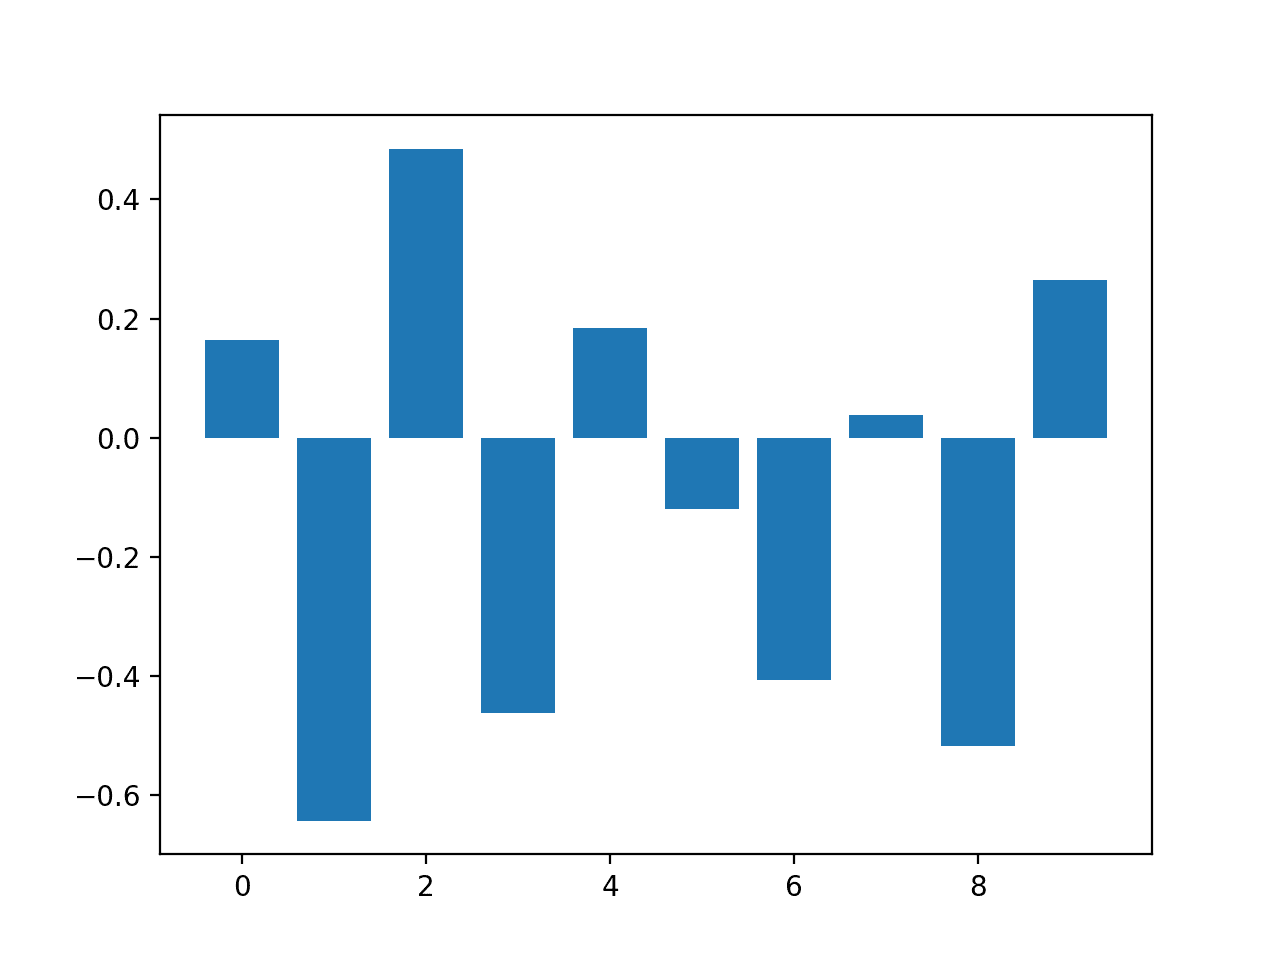
Bar Chart of Logistic Regression Coefficients as Feature Importance Scores
Now that we have seen the use of coefficients as importance scores, let’s look at the more common example of decision-tree-based importance scores.
Decision Tree Feature Importance
Decision tree algorithms like classification and regression trees (CART) offer importance scores based on the reduction in the criterion used to select split points, like Gini or entropy.
This same approach can be used for ensembles of decision trees, such as the random forest and stochastic gradient boosting algorithms.
Let’s take a look at a worked example of each.
CART Feature Importance
We can use the CART algorithm for feature importance implemented in scikit-learn as the DecisionTreeRegressor and DecisionTreeClassifier classes.
After being fit, the model provides a feature_importances_ property that can be accessed to retrieve the relative importance scores for each input feature.
Let’s take a look at an example of this for regression and classification.
CART Regression Feature Importance
The complete example of fitting a DecisionTreeRegressor and summarizing the calculated feature importance scores is listed below.
# decision tree for feature importance on a regression problem
from sklearn.datasets import make_regression
from sklearn.tree import DecisionTreeRegressor
from matplotlib import pyplot
# define dataset
X, y = make_regression(n_samples=1000, n_features=10, n_informative=5, random_state=1)
# define the model
model = DecisionTreeRegressor()
# fit the model
model.fit(X, y)
# get importance
importance = model.feature_importances_
# summarize feature importance
for i,v in enumerate(importance):
        print('Feature: %0d, Score: %.5f' % (i,v))
# plot feature importance
pyplot.bar([x for x in range(len(importance))], importance)
pyplot.show()
Running the example fits the model, then reports the coefficient value for each feature.
The results suggest perhaps three of the 10 features as being important to prediction.
Feature: 0, Score: 0.00294
Feature: 1, Score: 0.00502
Feature: 2, Score: 0.00318
Feature: 3, Score: 0.00151
Feature: 4, Score: 0.51648
Feature: 5, Score: 0.43814
Feature: 6, Score: 0.02723
Feature: 7, Score: 0.00200
Feature: 8, Score: 0.00244
Feature: 9, Score: 0.00106
A bar chart is then created for the feature importance scores.
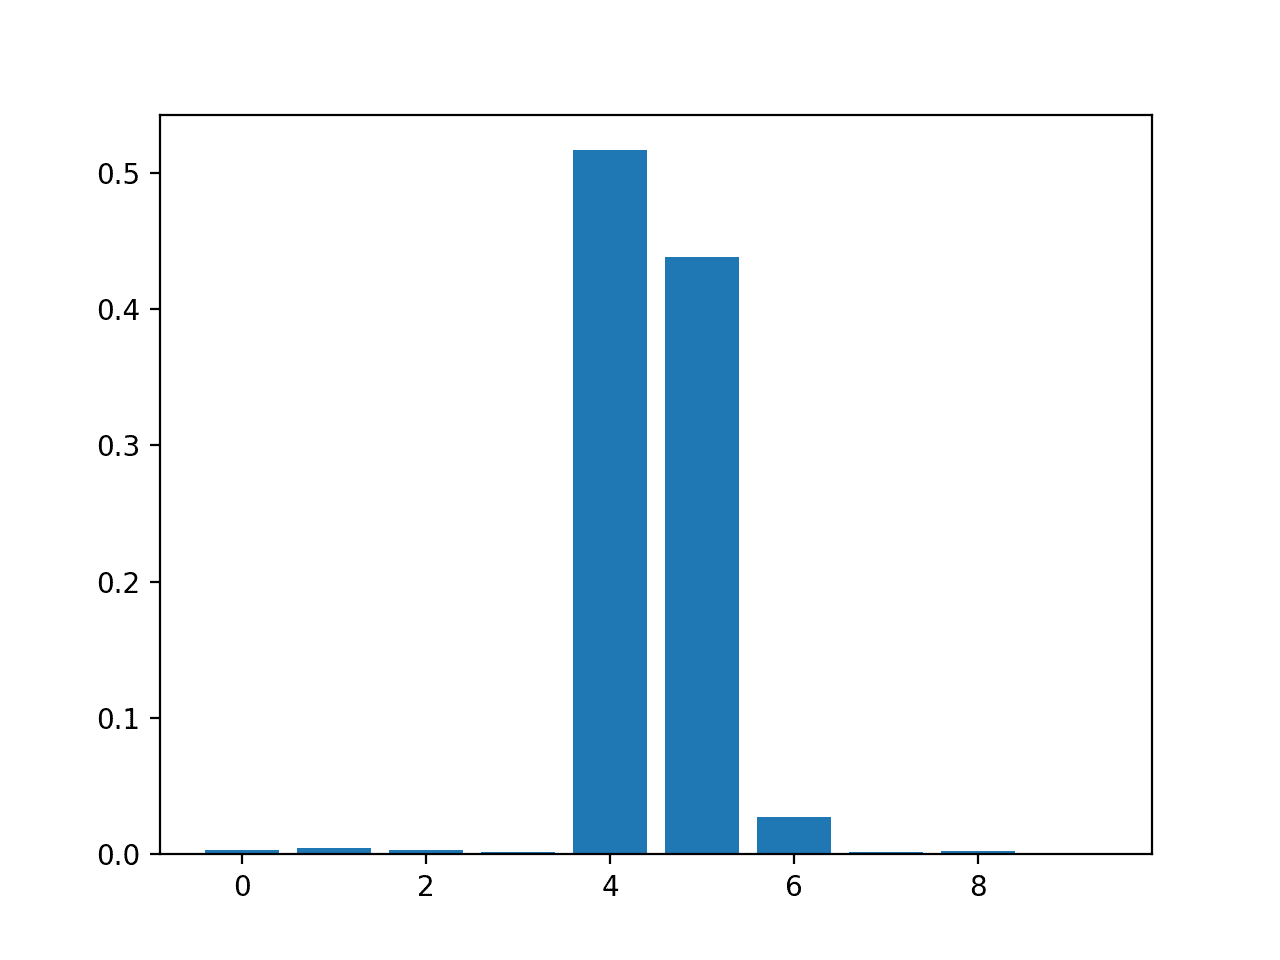
Bar Chart of DecisionTreeRegressor Feature Importance Scores
CART Classification Feature Importance
The complete example of fitting a DecisionTreeClassifier and summarizing the calculated feature importance scores is listed below.
# decision tree for feature importance on a classification problem
from sklearn.datasets import make_classification
from sklearn.tree import DecisionTreeClassifier
from matplotlib import pyplot
# define dataset
X, y = make_classification(n_samples=1000, n_features=10, n_informative=5, n_redundant=5, random_state=1)
# define the model
model = DecisionTreeClassifier()
# fit the model
model.fit(X, y)
# get importance
importance = model.feature_importances_
# summarize feature importance
for i,v in enumerate(importance):
        print('Feature: %0d, Score: %.5f' % (i,v))
# plot feature importance
pyplot.bar([x for x in range(len(importance))], importance)
pyplot.show()
Running the example fits the model, then reports the coefficient value for each feature.
The results suggest perhaps four of the 10 features as being important to prediction.
Feature: 0, Score: 0.01486
Feature: 1, Score: 0.01029
Feature: 2, Score: 0.18347
Feature: 3, Score: 0.30295
Feature: 4, Score: 0.08124
Feature: 5, Score: 0.00600
Feature: 6, Score: 0.19646
Feature: 7, Score: 0.02908
Feature: 8, Score: 0.12820
Feature: 9, Score: 0.04745
A bar chart is then created for the feature importance scores.
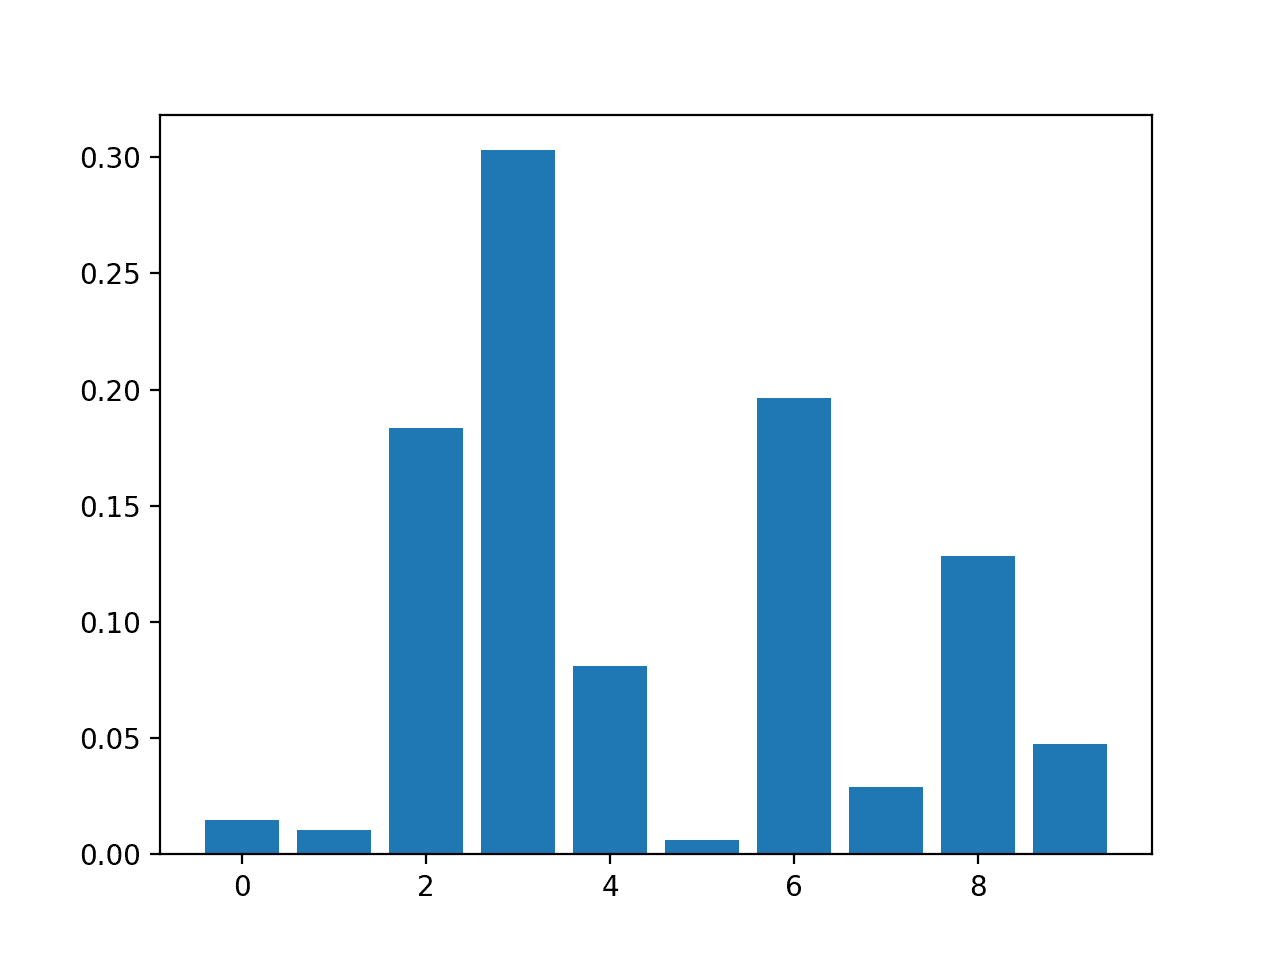
Bar Chart of DecisionTreeClassifier Feature Importance Scores
Random Forest Feature Importance
We can use the Random Forest algorithm for feature importance implemented in scikit-learn as the RandomForestRegressor and RandomForestClassifier classes.
After being fit, the model provides a feature_importances_ property that can be accessed to retrieve the relative importance scores for each input feature.
This approach can also be used with the bagging and extra trees algorithms.
Let’s take a look at an example of this for regression and classification.
Random Forest Regression Feature Importance
The complete example of fitting a RandomForestRegressor and summarizing the calculated feature importance scores is listed below.
# random forest for feature importance on a regression problem
from sklearn.datasets import make_regression
from sklearn.ensemble import RandomForestRegressor
from matplotlib import pyplot
# define dataset
X, y = make_regression(n_samples=1000, n_features=10, n_informative=5, random_state=1)
# define the model
model = RandomForestRegressor()
# fit the model
model.fit(X, y)
# get importance
importance = model.feature_importances_
# summarize feature importance
for i,v in enumerate(importance):
        print('Feature: %0d, Score: %.5f' % (i,v))
# plot feature importance
pyplot.bar([x for x in range(len(importance))], importance)
pyplot.show()
Running the example fits the model, then reports the coefficient value for each feature.
The results suggest perhaps two or three of the 10 features as being important to prediction.
Feature: 0, Score: 0.00280
Feature: 1, Score: 0.00545
Feature: 2, Score: 0.00294
Feature: 3, Score: 0.00289
Feature: 4, Score: 0.52992
Feature: 5, Score: 0.42046
Feature: 6, Score: 0.02663
Feature: 7, Score: 0.00304
Feature: 8, Score: 0.00304
Feature: 9, Score: 0.00283
A bar chart is then created for the feature importance scores.
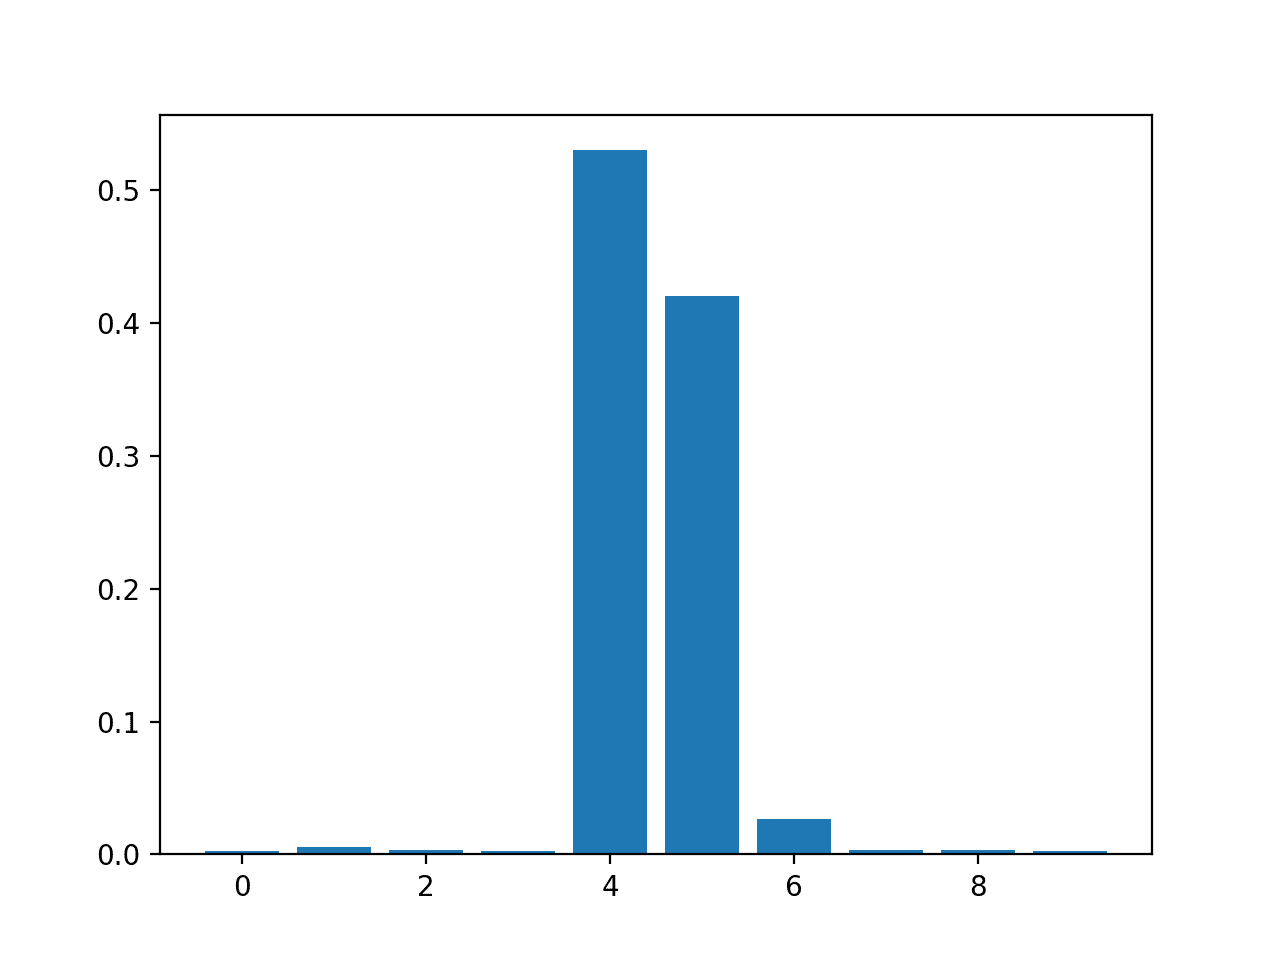
Bar Chart of RandomForestRegressor Feature Importance Scores
Random Forest Classification Feature Importance
The complete example of fitting a RandomForestClassifier and summarizing the calculated feature importance scores is listed below.
# random forest for feature importance on a classification problem
from sklearn.datasets import make_classification
from sklearn.ensemble import RandomForestClassifier
from matplotlib import pyplot
# define dataset
X, y = make_classification(n_samples=1000, n_features=10, n_informative=5, n_redundant=5, random_state=1)
# define the model
model = RandomForestClassifier()
# fit the model
model.fit(X, y)
# get importance
importance = model.feature_importances_
# summarize feature importance
for i,v in enumerate(importance):
        print('Feature: %0d, Score: %.5f' % (i,v))
# plot feature importance
pyplot.bar([x for x in range(len(importance))], importance)
pyplot.show()
Running the example fits the model, then reports the coefficient value for each feature.
The results suggest perhaps two or three of the 10 features as being important to prediction.
Feature: 0, Score: 0.06523
Feature: 1, Score: 0.10737
Feature: 2, Score: 0.15779
Feature: 3, Score: 0.20422
Feature: 4, Score: 0.08709
Feature: 5, Score: 0.09948
Feature: 6, Score: 0.10009
Feature: 7, Score: 0.04551
Feature: 8, Score: 0.08830
Feature: 9, Score: 0.04493
A bar chart is then created for the feature importance scores.
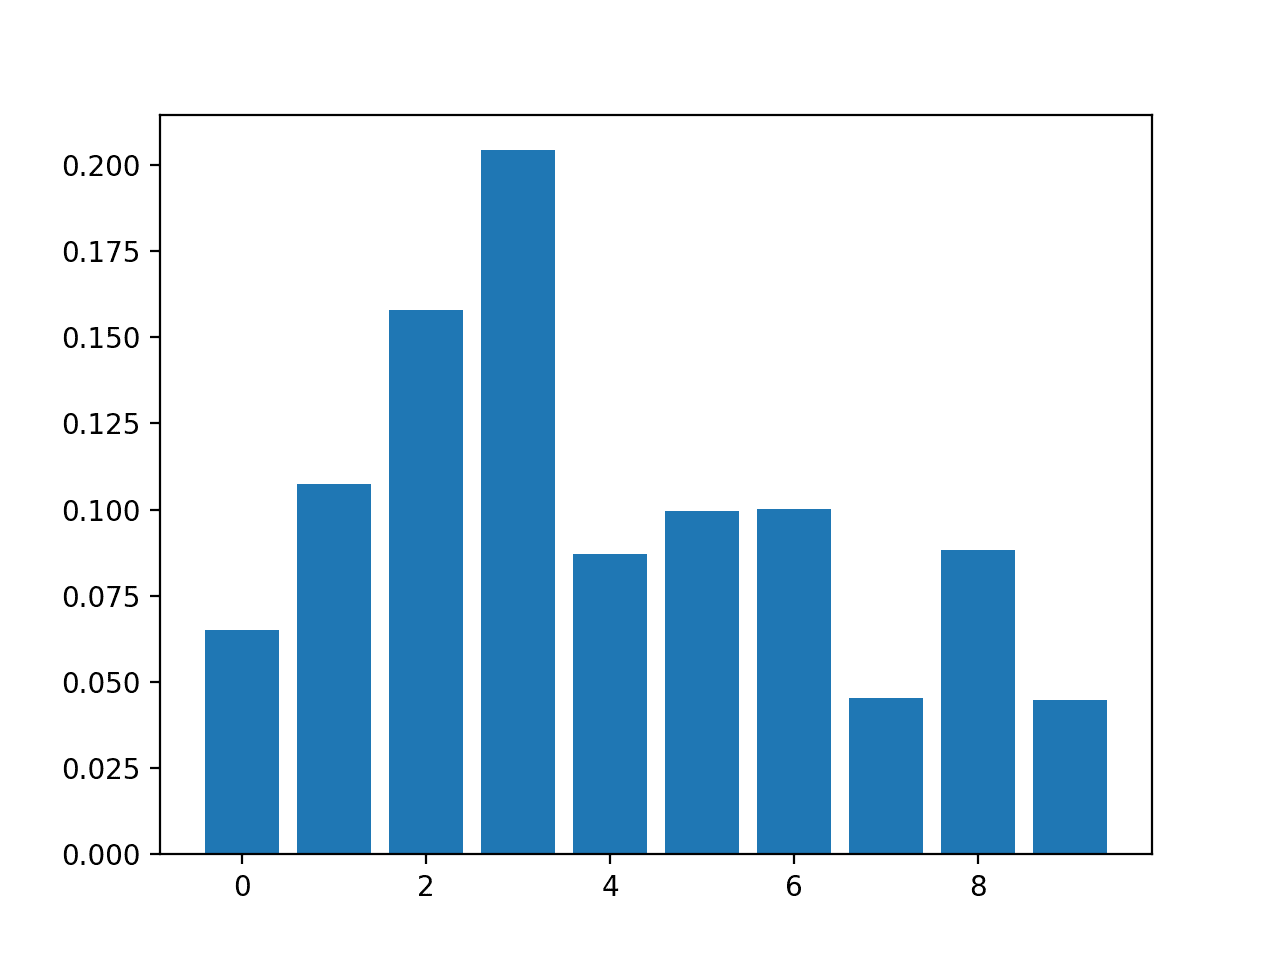
Bar Chart of RandomForestClassifier Feature Importance Scores
XGBoost Feature Importance
XGBoost is a library that provides an efficient and effective implementation of the stochastic gradient boosting algorithm.
This algorithm can be used with scikit-learn via the XGBRegressor and XGBClassifier classes.
After being fit, the model provides a feature_importances_ property that can be accessed to retrieve the relative importance scores for each input feature.
This algorithm is also provided via scikit-learn via the GradientBoostingClassifier and GradientBoostingRegressor classes and the same approach to feature selection can be used.
First, install the XGBoost library, such as with pip:
sudo pip install xgboost
Then confirm that the library was installed correctly and works by checking the version number.
# check xgboost version
import xgboost
print(xgboost.__version__)
Running the example, you should see the following version number or higher.
0.90
For more on the XGBoost library, start here:
Let’s take a look at an example of XGBoost for feature importance on regression and classification problems.
XGBoost Regression Feature Importance
The complete example of fitting a XGBRegressor and summarizing the calculated feature importance scores is listed below.
# xgboost for feature importance on a regression problem
from sklearn.datasets import make_regression
from xgboost import XGBRegressor
from matplotlib import pyplot
# define dataset
X, y = make_regression(n_samples=1000, n_features=10, n_informative=5, random_state=1)
# define the model
model = XGBRegressor()
# fit the model
model.fit(X, y)
# get importance
importance = model.feature_importances_
# summarize feature importance
for i,v in enumerate(importance):
        print('Feature: %0d, Score: %.5f' % (i,v))
# plot feature importance
pyplot.bar([x for x in range(len(importance))], importance)
pyplot.show()
Running the example fits the model, then reports the coefficient value for each feature.
The results suggest perhaps two or three of the 10 features as being important to prediction.
Feature: 0, Score: 0.00060
Feature: 1, Score: 0.01917
Feature: 2, Score: 0.00091
Feature: 3, Score: 0.00118
Feature: 4, Score: 0.49380
Feature: 5, Score: 0.42342
Feature: 6, Score: 0.05057
Feature: 7, Score: 0.00419
Feature: 8, Score: 0.00124
Feature: 9, Score: 0.00491
A bar chart is then created for the feature importance scores.
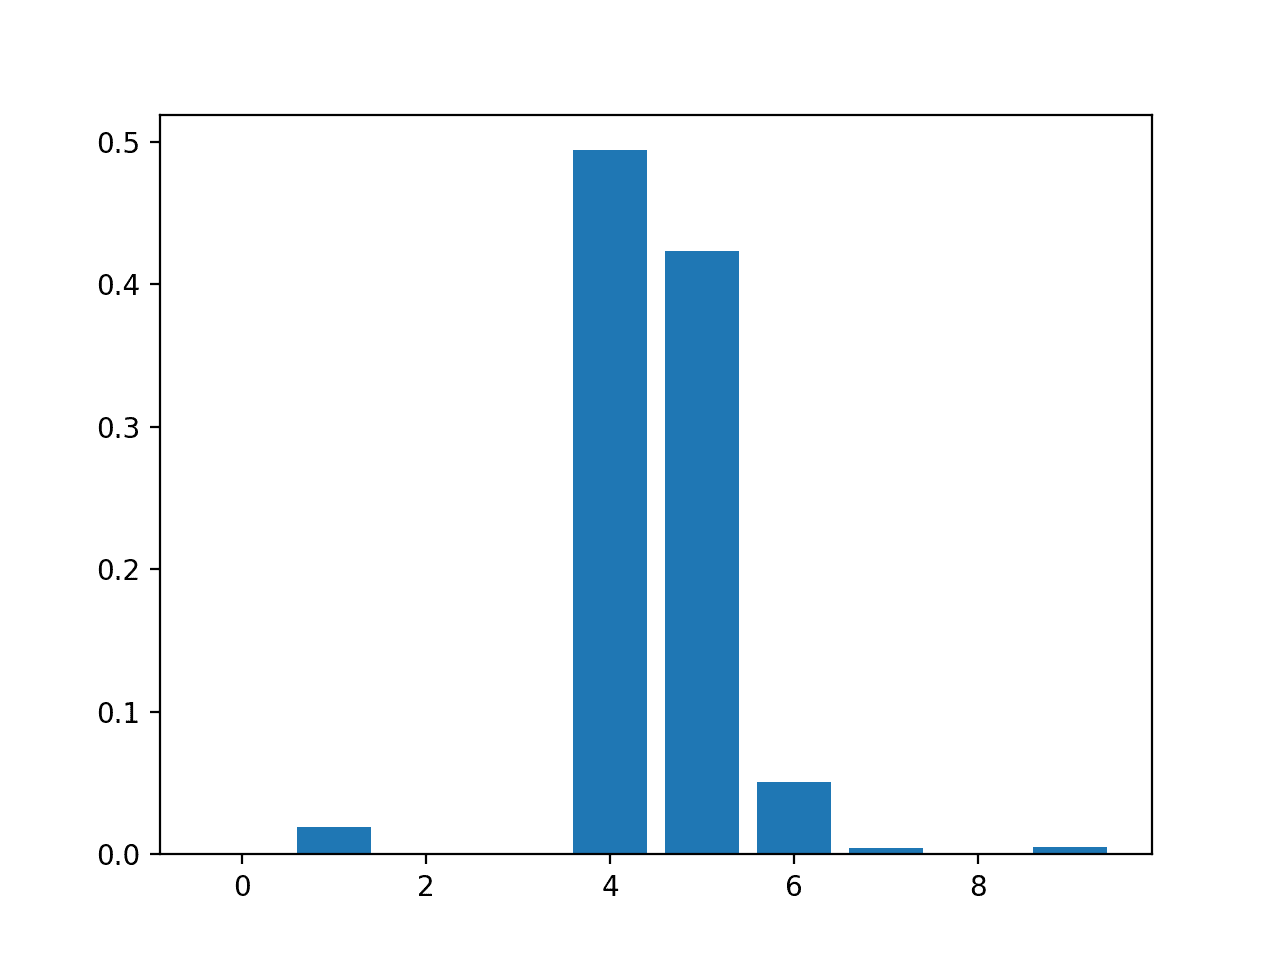
Bar Chart of XGBRegressor Feature Importance Scores
XGBoost Classification Feature Importance
The complete example of fitting an XGBClassifier and summarizing the calculated feature importance scores is listed below.
# xgboost for feature importance on a classification problem
from sklearn.datasets import make_classification
from xgboost import XGBClassifier
from matplotlib import pyplot
# define dataset
X, y = make_classification(n_samples=1000, n_features=10, n_informative=5, n_redundant=5, random_state=1)
# define the model
model = XGBClassifier()
# fit the model
model.fit(X, y)
# get importance
importance = model.feature_importances_
# summarize feature importance
for i,v in enumerate(importance):
        print('Feature: %0d, Score: %.5f' % (i,v))
# plot feature importance
pyplot.bar([x for x in range(len(importance))], importance)
pyplot.show()
Running the example fits the model then reports the coefficient value for each feature.
The results suggest perhaps seven of the 10 features as being important to prediction.
Feature: 0, Score: 0.02464
Feature: 1, Score: 0.08153
Feature: 2, Score: 0.12516
Feature: 3, Score: 0.28400
Feature: 4, Score: 0.12694
Feature: 5, Score: 0.10752
Feature: 6, Score: 0.08624
Feature: 7, Score: 0.04820
Feature: 8, Score: 0.09357
Feature: 9, Score: 0.02220
A bar chart is then created for the feature importance scores.
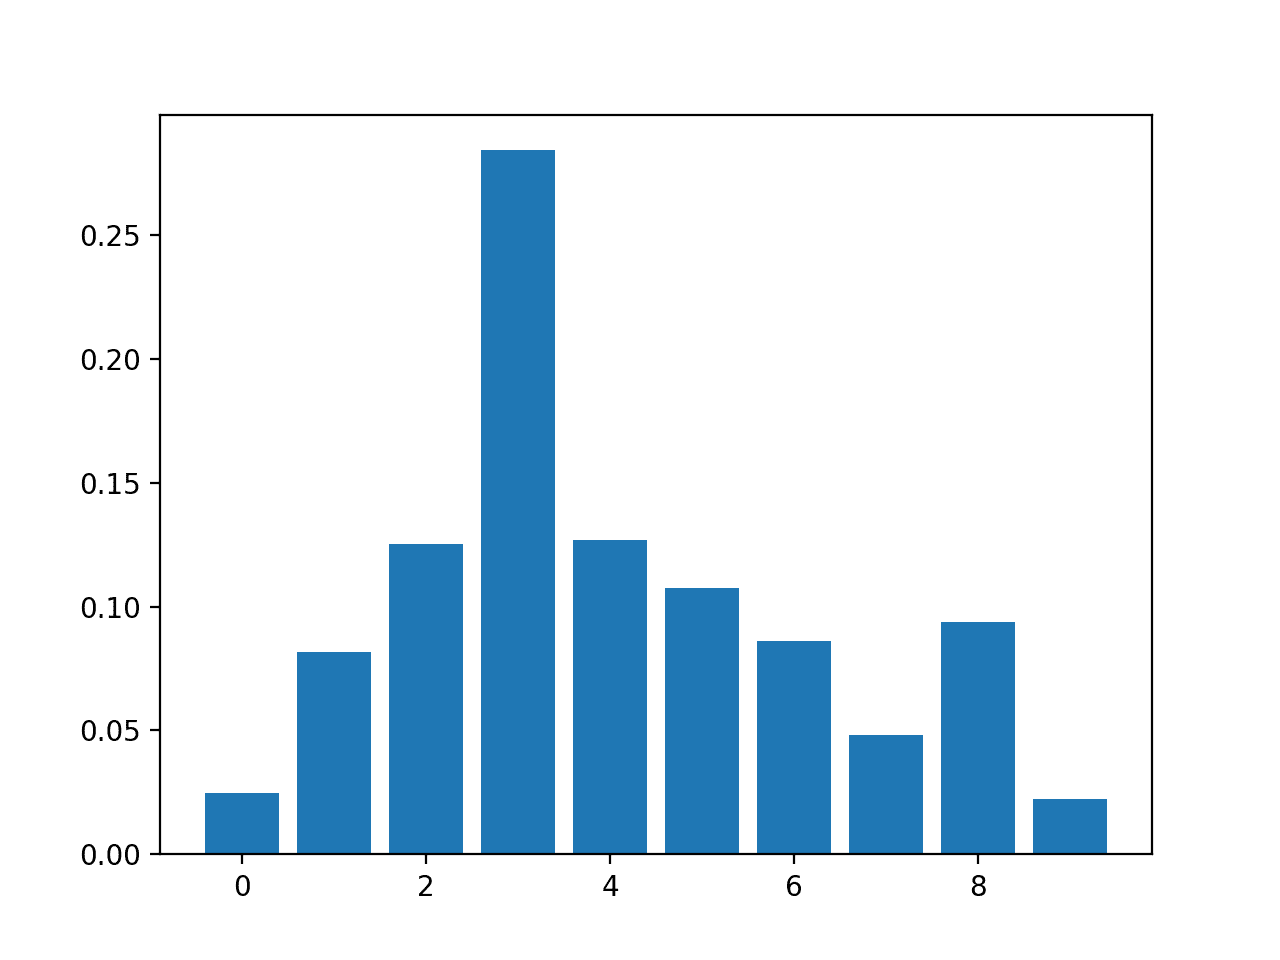
Bar Chart of XGBClassifier Feature Importance Scores
Permutation Feature Importance
Permutation feature importance is a technique for calculating relative importance scores that is independent of the model used.
First, a model is fit on the dataset, such as a model that does not support native feature importance scores. Then the model is used to make predictions on a dataset, although the values of a feature (column) in the dataset are scrambled. This is repeated for each feature in the dataset. Then this whole process is repeated 3, 5, 10 or more times. The result is a mean importance score for each input feature (and distribution of scores given the repeats).
This approach can be used for regression or classification and requires that a performance metric be chosen as the basis of the importance score, such as the mean squared error for regression and accuracy for classification.
Permutation feature selection can be used via the permutation_importance() function that takes a fit model, a dataset (train or test dataset is fine), and a scoring function.
Let’s take a look at this approach to feature selection with an algorithm that does not support feature selection natively, specifically k-nearest neighbors.
Permutation Feature Importance for Regression
The complete example of fitting a KNeighborsRegressor and summarizing the calculated permutation feature importance scores is listed below.
# permutation feature importance with knn for regression
from sklearn.datasets import make_regression
from sklearn.neighbors import KNeighborsRegressor
from sklearn.inspection import permutation_importance
from matplotlib import pyplot
# define dataset
X, y = make_regression(n_samples=1000, n_features=10, n_informative=5, random_state=1)
# define the model
model = KNeighborsRegressor()
# fit the model
model.fit(X, y)
# perform permutation importance
results = permutation_importance(model, X, y, scoring='neg_mean_squared_error')
# get importance
importance = results.importances_mean
# summarize feature importance
for i,v in enumerate(importance):
        print('Feature: %0d, Score: %.5f' % (i,v))
# plot feature importance
pyplot.bar([x for x in range(len(importance))], importance)
pyplot.show()
Running the example fits the model, then reports the coefficient value for each feature.
The results suggest perhaps two or three of the 10 features as being important to prediction.
Feature: 0, Score: 175.52007
Feature: 1, Score: 345.80170
Feature: 2, Score: 126.60578
Feature: 3, Score: 95.90081
Feature: 4, Score: 9666.16446
Feature: 5, Score: 8036.79033
Feature: 6, Score: 929.58517
Feature: 7, Score: 139.67416
Feature: 8, Score: 132.06246
Feature: 9, Score: 84.94768
A bar chart is then created for the feature importance scores.
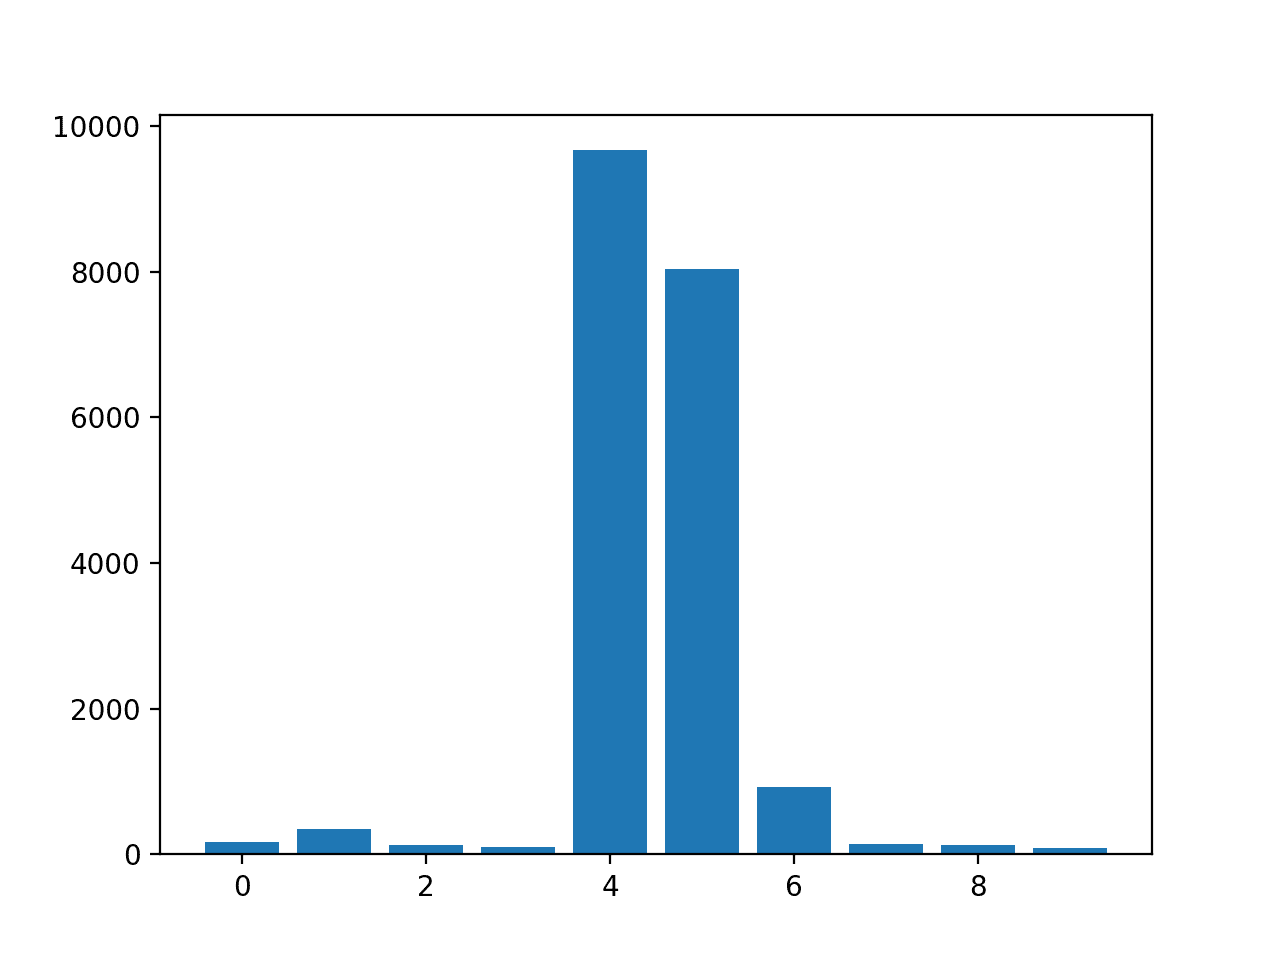
Bar Chart of KNeighborsRegressor With Permutation Feature Importance Scores
Permutation Feature Importance for Classification
The complete example of fitting a KNeighborsClassifier and summarizing the calculated permutation feature importance scores is listed below.
# permutation feature importance with knn for classification
from sklearn.datasets import make_classification
from sklearn.neighbors import KNeighborsClassifier
from sklearn.inspection import permutation_importance
from matplotlib import pyplot
# define dataset
X, y = make_classification(n_samples=1000, n_features=10, n_informative=5, n_redundant=5, random_state=1)
# define the model
model = KNeighborsClassifier()
# fit the model
model.fit(X, y)
# perform permutation importance
results = permutation_importance(model, X, y, scoring='accuracy')
# get importance
importance = results.importances_mean
# summarize feature importance
for i,v in enumerate(importance):
        print('Feature: %0d, Score: %.5f' % (i,v))
# plot feature importance
pyplot.bar([x for x in range(len(importance))], importance)
pyplot.show()
Running the example fits the model, then reports the coefficient value for each feature.
The results suggest perhaps two or three of the 10 features as being important to prediction.
Feature: 0, Score: 0.04760
Feature: 1, Score: 0.06680
Feature: 2, Score: 0.05240
Feature: 3, Score: 0.09300
Feature: 4, Score: 0.05140
Feature: 5, Score: 0.05520
Feature: 6, Score: 0.07920
Feature: 7, Score: 0.05560
Feature: 8, Score: 0.05620
Feature: 9, Score: 0.03080
A bar chart is then created for the feature importance scores.
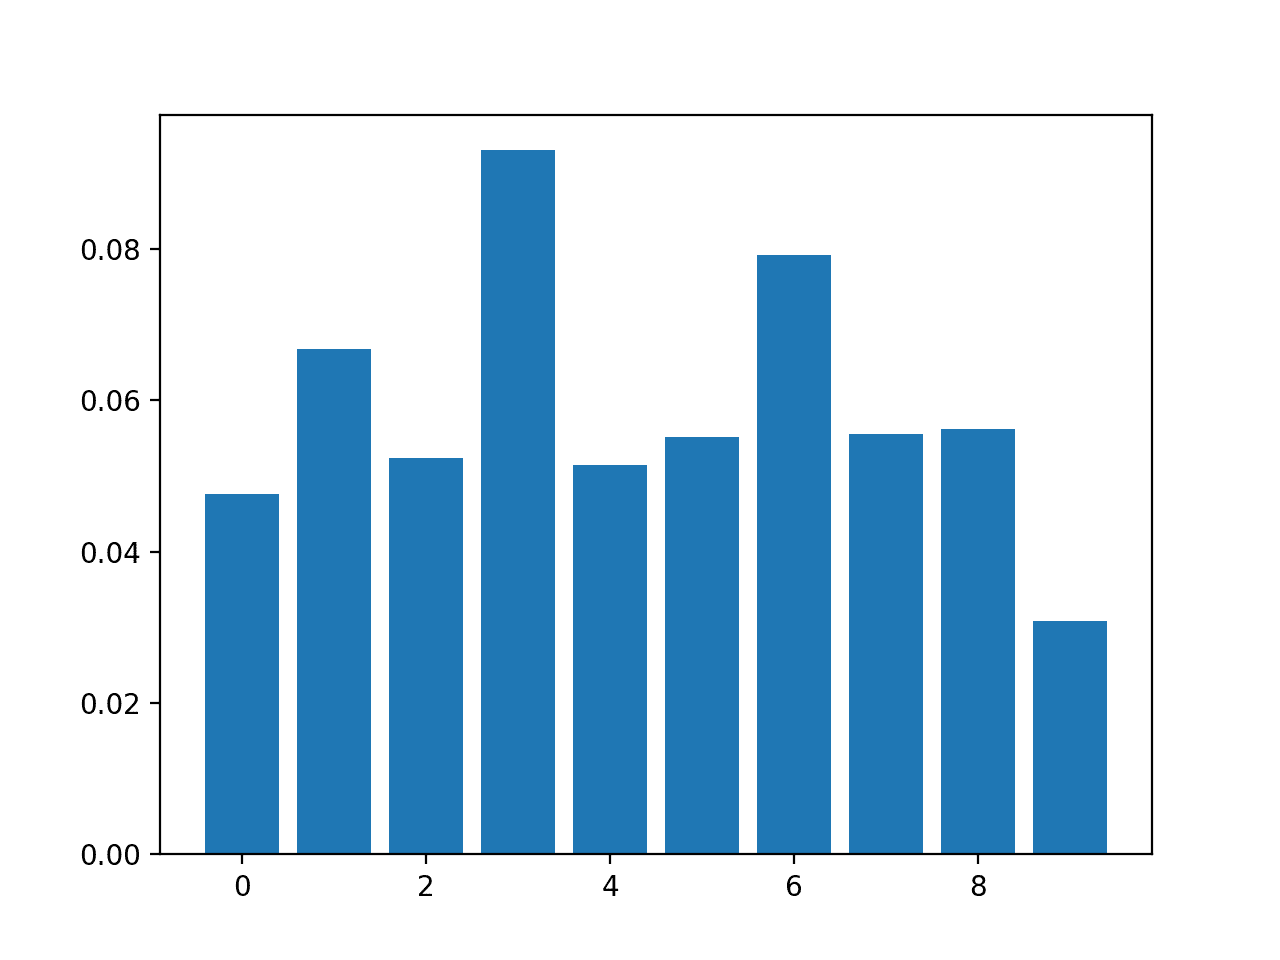
Bar Chart of KNeighborsClassifier With Permutation Feature Importance Scores
Further Reading
This section provides more resources on the topic if you are looking to go deeper.
Related Tutorials
- How to Choose a Feature Selection Method For Machine Learning
- How to Perform Feature Selection with Categorical Data
- Feature Importance and Feature Selection With XGBoost in Python
- Feature Selection For Machine Learning in Python
- An Introduction to Feature Selection
APIs
- Feature selection, scikit-learn API.
- Permutation feature importance, scikit-learn API.
- sklearn.datasets.make_classification API.
- sklearn.datasets.make_regression API.
- XGBoost Python API Reference.
- sklearn.inspection.permutation_importance API.
Summary
In this tutorial, you discovered feature importance scores for machine learning in python
Specifically, you learned:
- The role of feature importance in a predictive modeling problem.
- How to calculate and review feature importance from linear models and decision trees.
- How to calculate and review permutation feature importance scores.
Do you have any questions?
Ask your questions in the comments below and I will do my best to answer.
The post How to Calculate Feature Importance With Python appeared first on Machine Learning Mastery.
Ai
via https://www.AiUpNow.com
March 29, 2020 at 02:20PM by Jason Brownlee, Khareem Sudlow
